Insurance
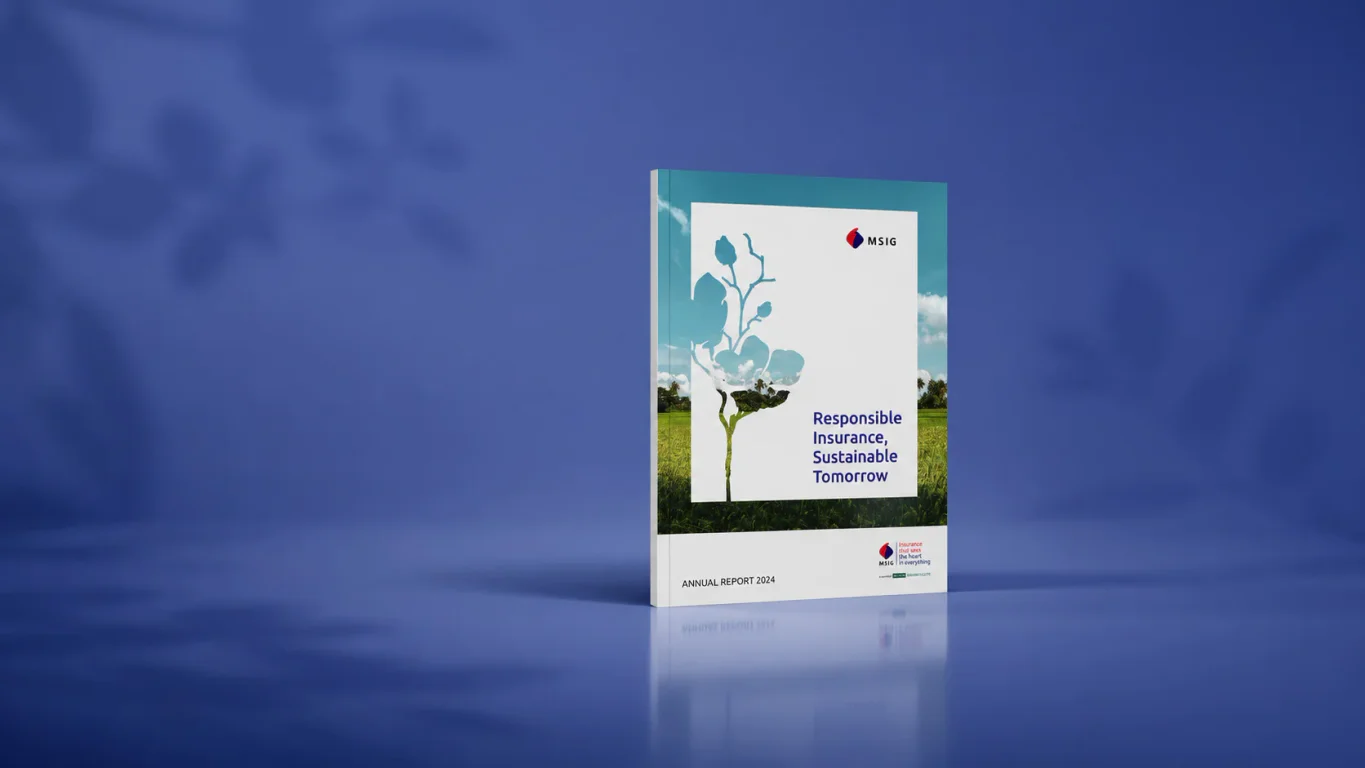
MSIG Insurance (Malaysia) Berhad
Annual Report
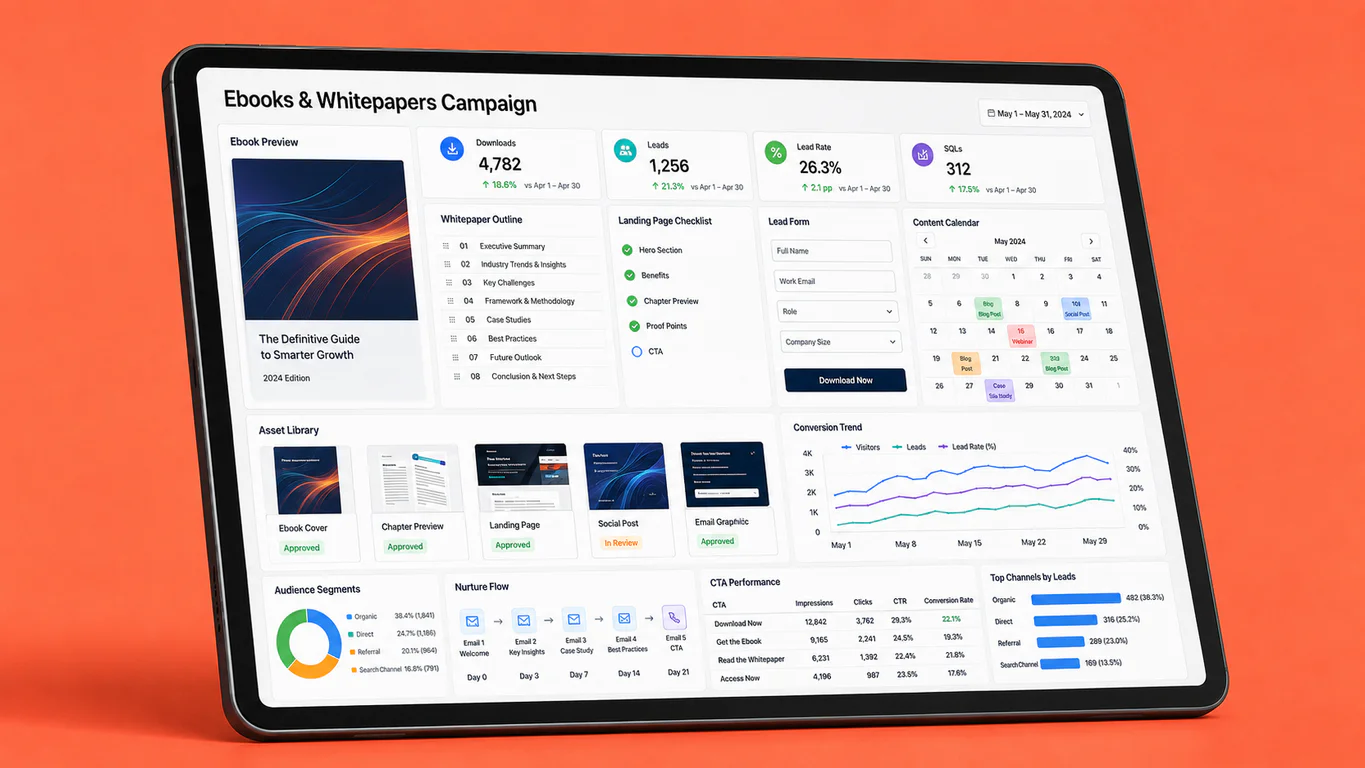
Governance and financial metrics translated into readable data visualization for an insurer.
View Case Study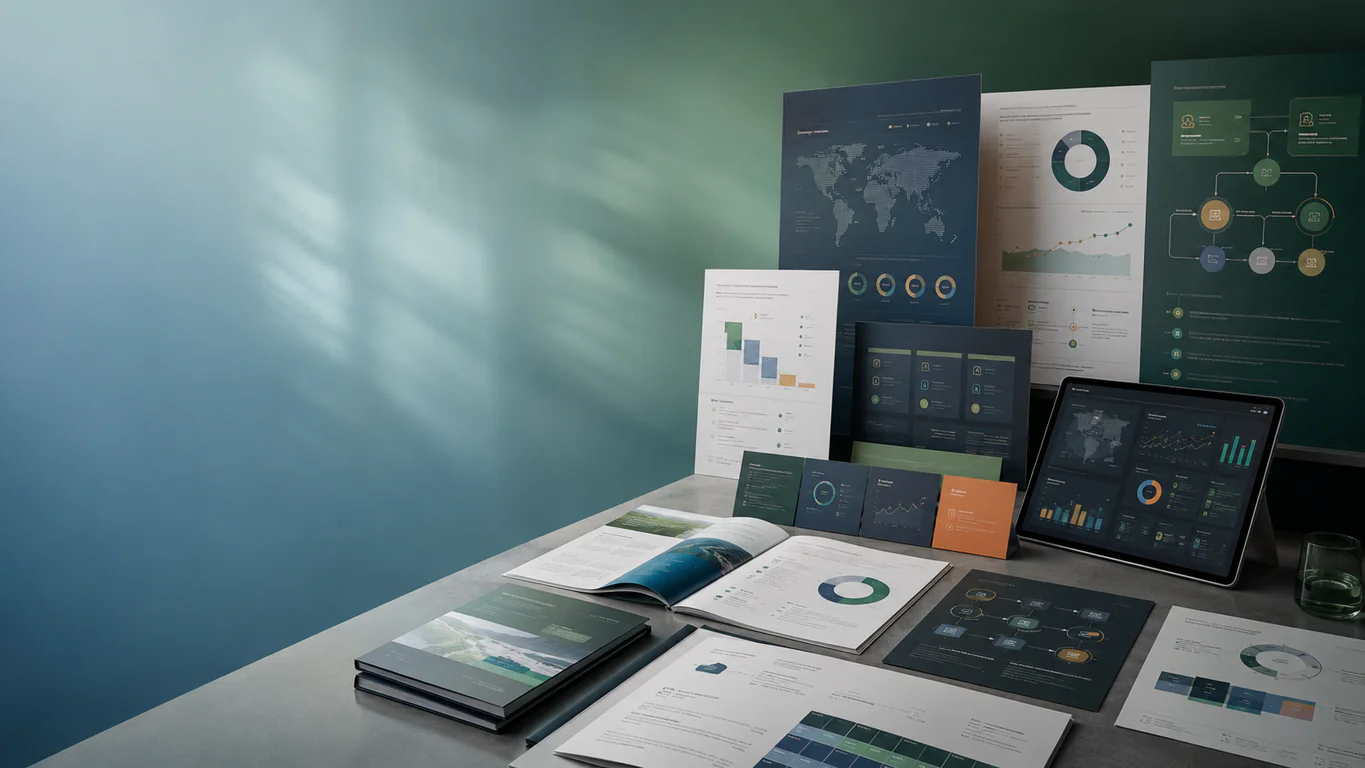
Walk Production designs infographics and data visualizations for SMEs, corporates, multinationals, and public-sector organizations across Dubai and the UAE. We turn complex, client-supplied data into clear, engaging visual stories.
From annual-report data visualization to 60-second animated explainers, an experienced in-house team handles storytelling, design, and motion. Static, animated, or both.
From annual-report data visualization to 60-second animated explainers, an experienced in-house team handles storytelling, design, and motion.
We design infographics for different purposes and industries, from financial services and tech to real estate and logistics.
Data-driven visuals presenting client-supplied research findings, survey results, or performance metrics.
Step-by-step visual guides explaining workflows, procedures, or methodologies.
Side-by-side visuals comparing options, features, or alternatives.
Chronological visuals showing history, milestones, or project phases.
Governance and financial metrics translated into readable data visualization for an insurer.
View Case Study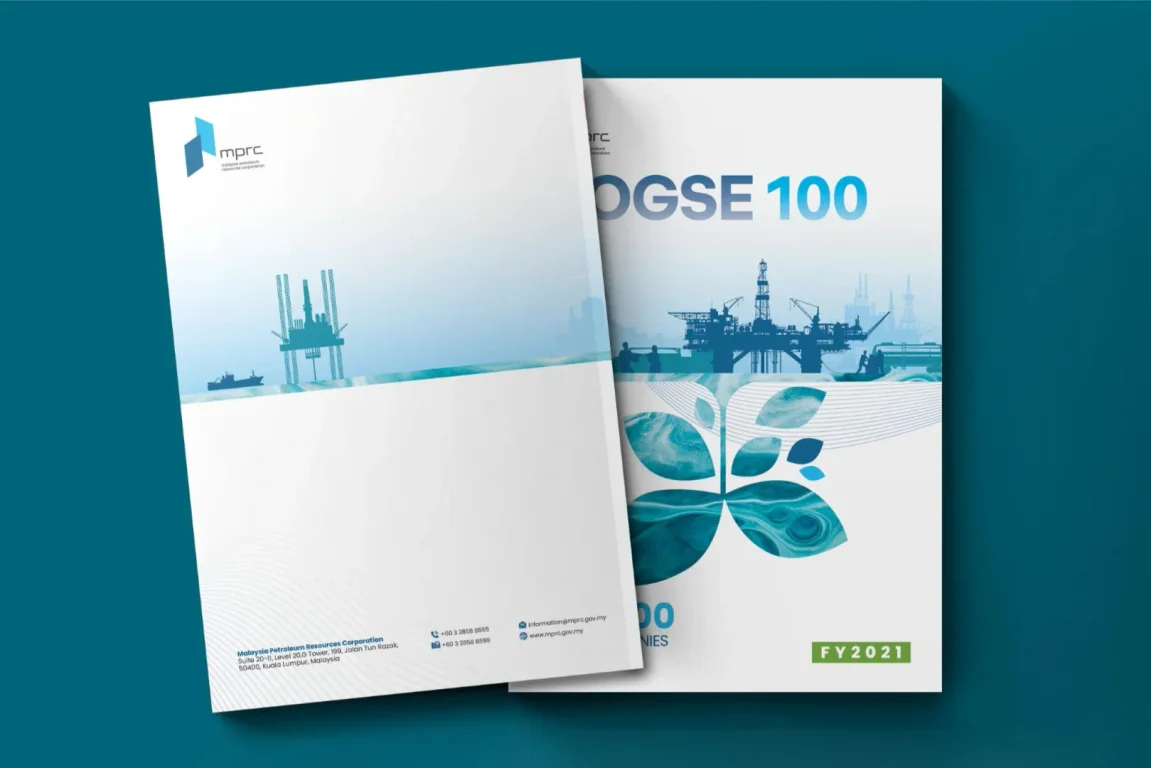
OGSE100 rankings and sector figures visualized across an oil-and-gas industry report.
View Case Study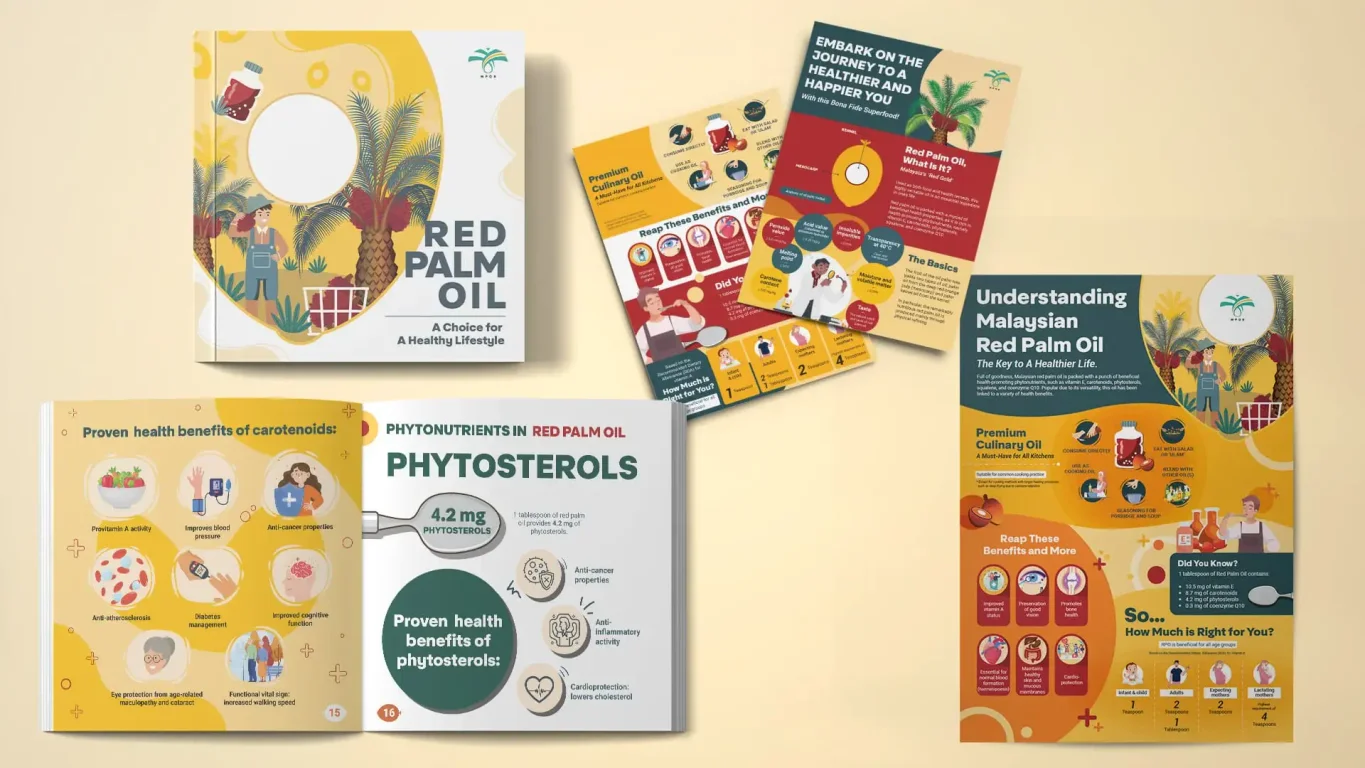
Multilingual infographic design presenting a red palm oil narrative in four languages.
View Case Study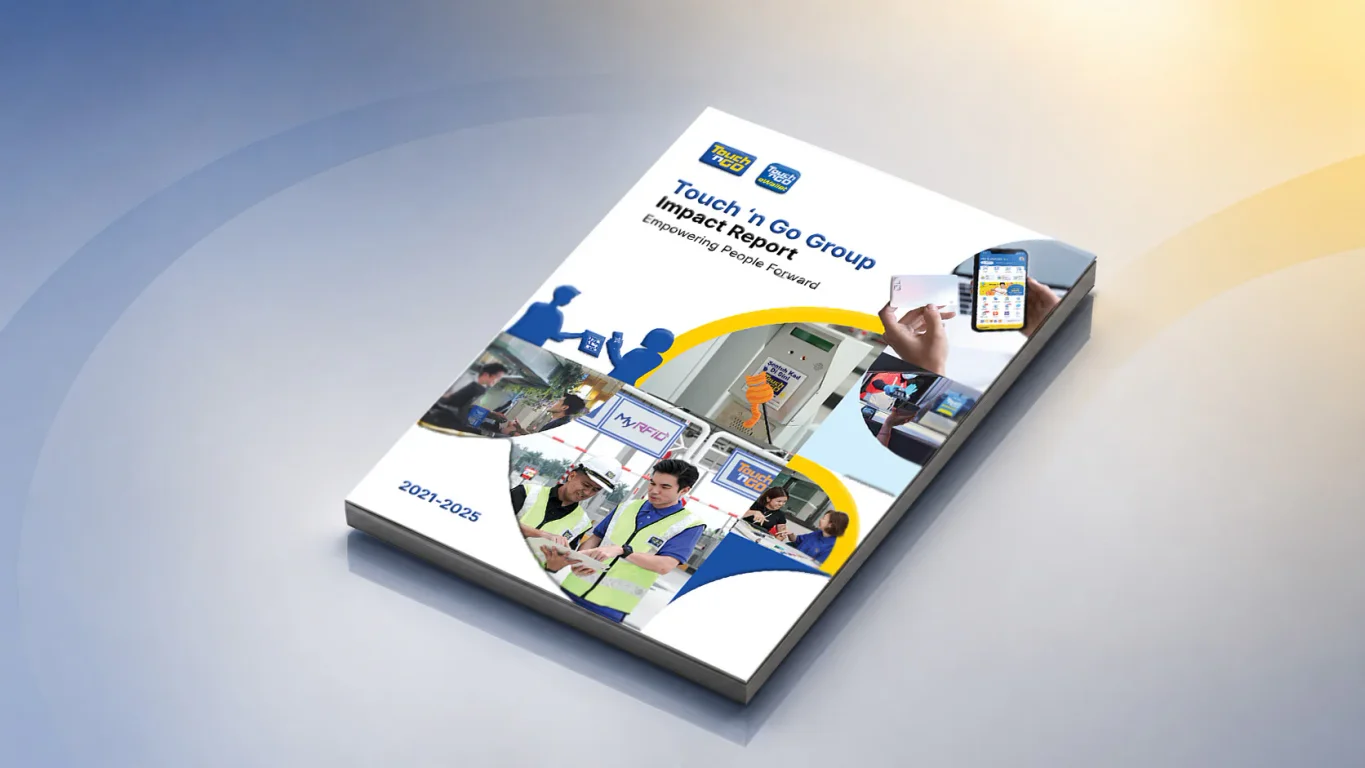
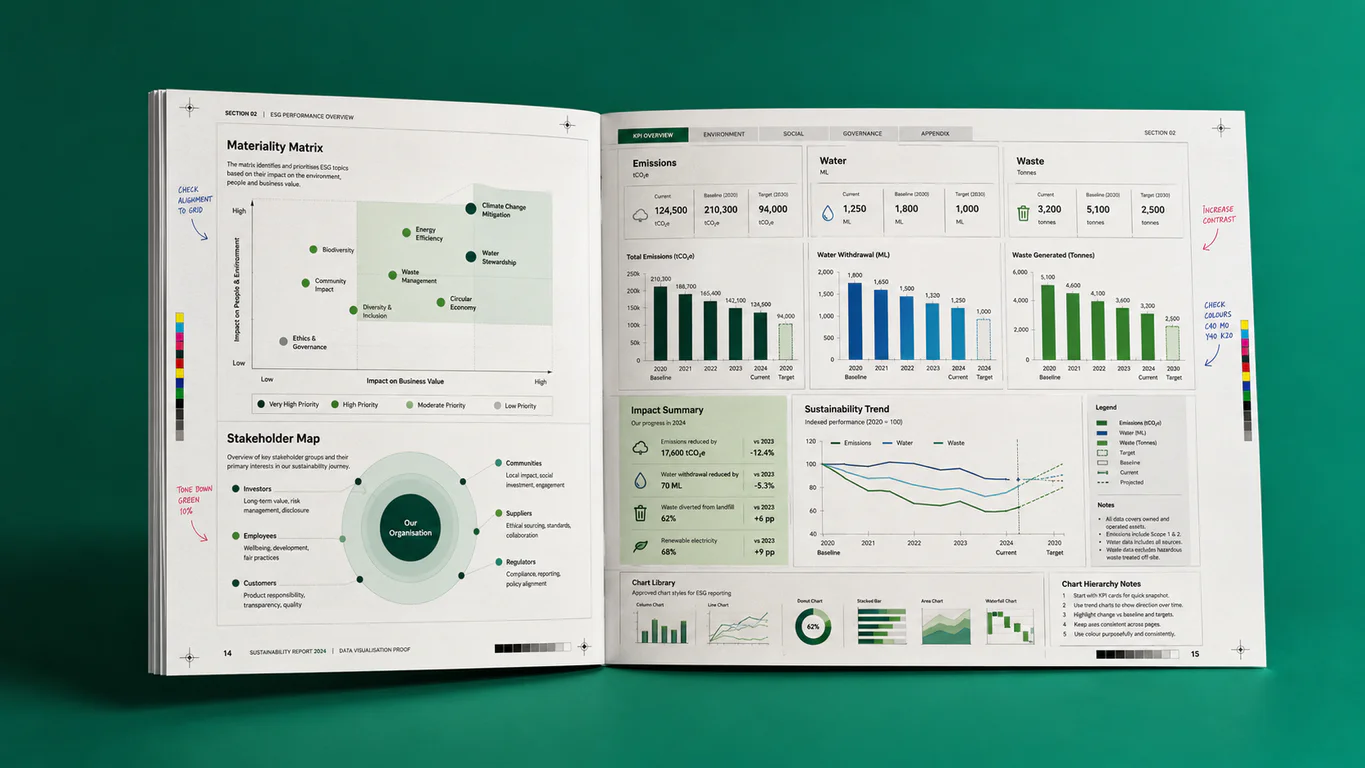
An impact report's four ESG pillars rendered as clear, navigable infographics.
View Case Study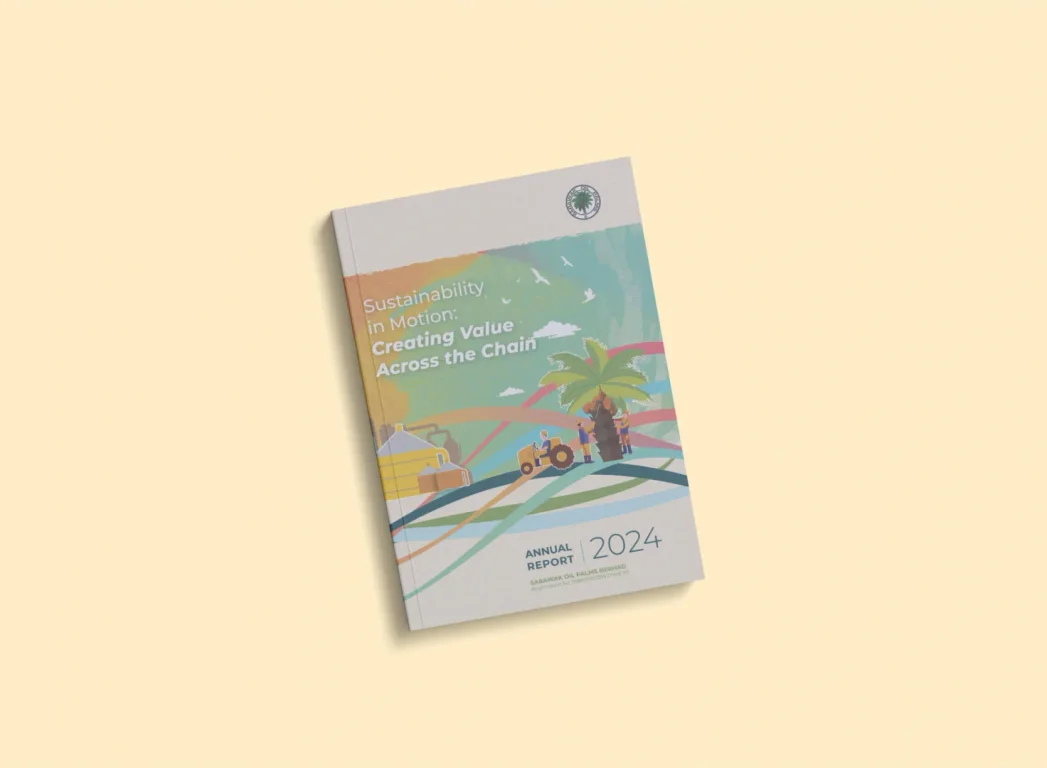
Annual-performance infographics built for a Sarawak palm-oil group's stakeholders.
View Case Study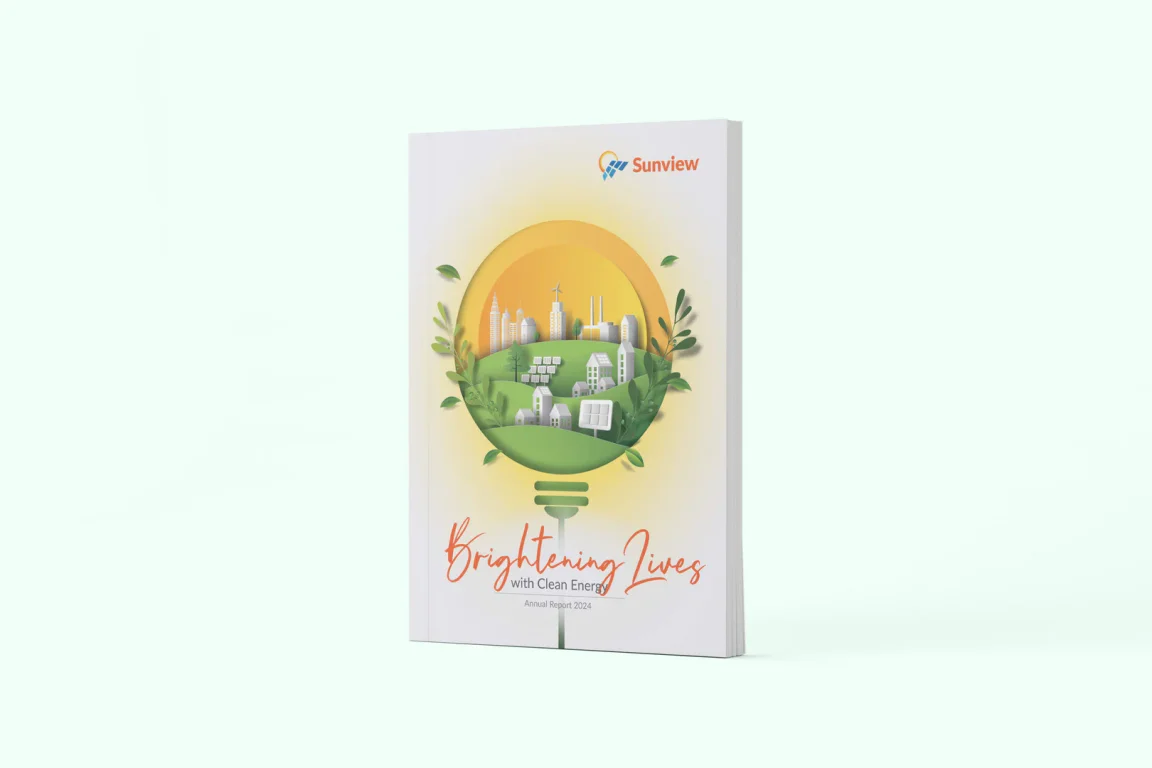
Project-portfolio and revenue data visualized for a listed renewable-energy group.
View Case StudyWe offer infographic design at different scope levels. Pricing scales with project scope. Request a quote to discuss your requirements.
A structured six-step process supports consistent quality from data review through multi-format export, with an optional animation stage for video channels.
We review your data, objectives, and target audience. Key messages and the story angle are identified.
We analyze your client-supplied data to find the most compelling insights. Data is cleaned and prepared for visualization.
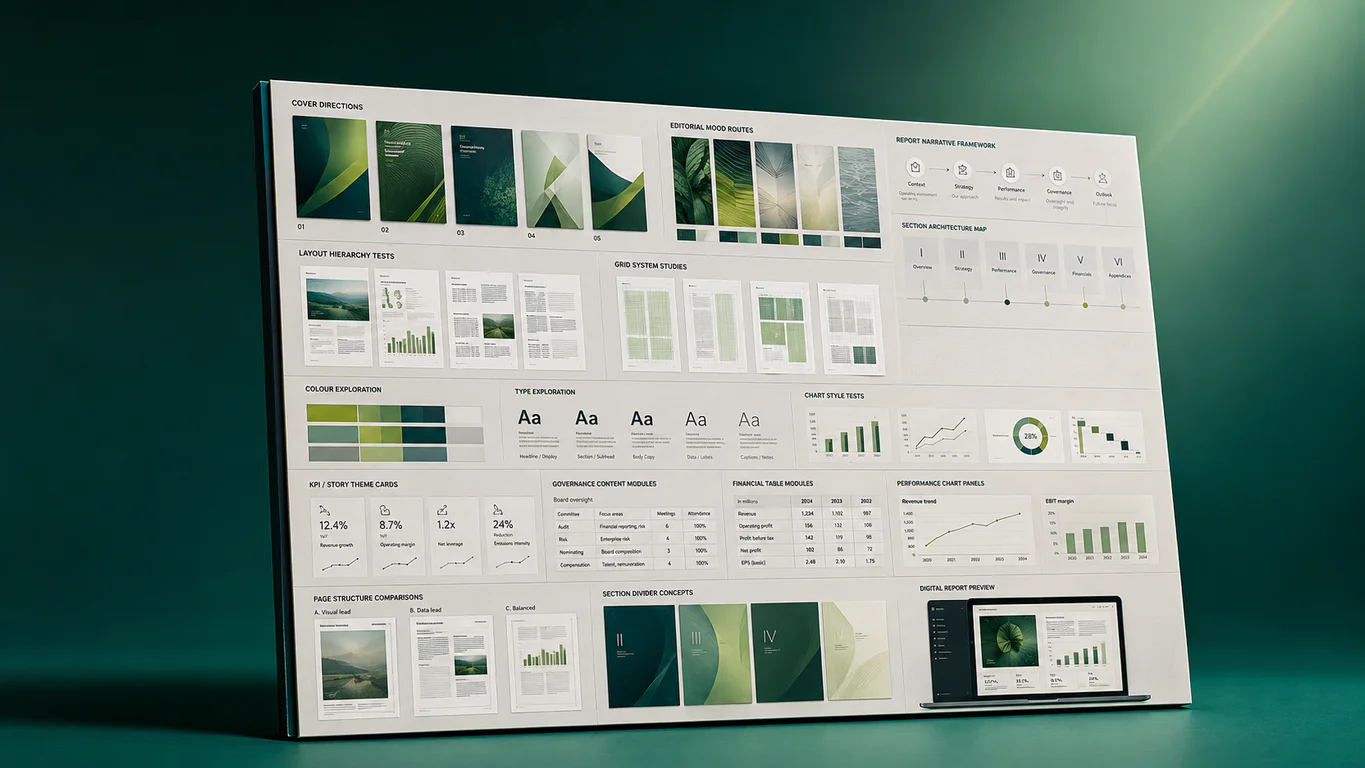
Infographic structure is developed with flow and hierarchy. A visual approach and style are proposed.
Full infographic design with custom graphics, icons, and typography. Data is visualized clearly.
The static infographic is animated for video format. Motion brings data to life for digital channels.
The infographic is exported in the required formats and sizes, optimized for different platforms.
Headline copy, chart annotations, and source-data interpretation are written by our content team alongside the visualization. Numbers and words are built as one piece, not two layers stacked on top of each other.
Information design requires careful editorial judgment. Senior designers with 10+ years of editorial and data-visualization experience are briefed in-house alongside our copywriters and account team.
Static graphics for reports, decks, and social posts. Animated versions for video, social reels, and event screens. Same source data, two output formats from a single design pass.
A single infographic for a launch or report, a monthly retainer for marketing teams publishing data regularly, or annual-report and sustainability-report support for corporate communications teams who need 8 to 12 infographics in one run.
Long-form whitepapers and research publications with data visualization.
View ServiceAnnual reports with integrated infographics and data storytelling.
View ServiceThe full range of graphic design services across print and digital.
View ServiceThe more context you share, the sharper our first response. A rough scope and timeline are enough to begin.