Introduction
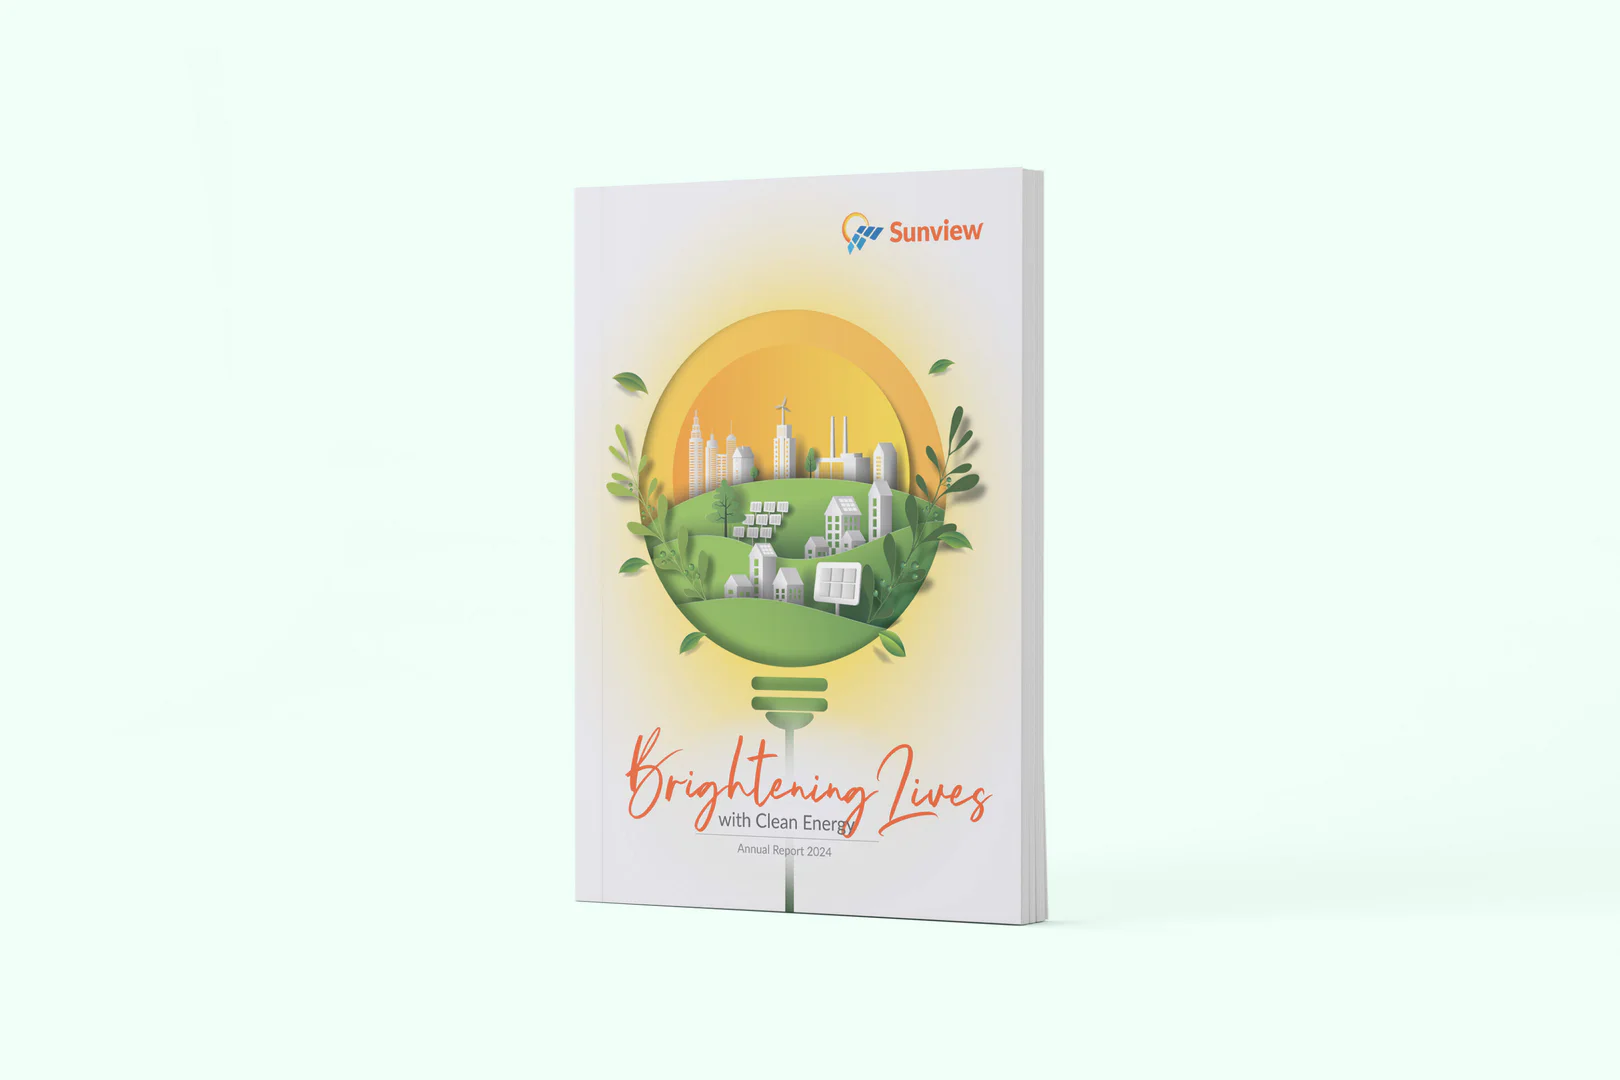
A solar group’s year reads through its installations as much as its financial results, and one publication has to carry both. Walk Production designed the 2023 annual report for Sunview Group Berhad, a publicly listed solar and renewable-energy group, from concept through print-ready handoff.
The scope covered concept development, layout design, visual data storytelling, and print coordination across the reporting year. Shareholders, analysts, and regulators each open the document looking for something different. A Dubai holding company or a DIFC-listed group writes for the same split readership, and one document has to serve every part of it.
Our Solutions
Concept and Visual Design
The design concept reflected Sunview’s growth and capability in the renewable-energy sector. Walk Production built a visual system around a color palette and graphic elements that signal reliability and technical credibility. The aesthetic suits a solar and clean-energy business while staying accessible to a broad investor audience. Visual elements were chosen to reinforce the company’s track record and operational strength.
The visual direction carried a narrative of progress, integrating approved project imagery with report content throughout the publication. The annual report formatting connected the company’s project achievements with its strategic outlook. Each visual element was selected to reinforce the company’s project track record across residential, commercial, and large-scale solar installations.
Layout Design and Data Presentation
The layout structured content across financial highlights, operational reviews, corporate governance, and sustainability sections of the report. Each area used consistent formatting and typographic hierarchy to support smooth navigation throughout the publication. The page structure presents narrative content and financial data in formats that stay readable across every section.
Custom renewable-energy report infographic design presented revenue data, project milestones, and key performance indicators through charts and visual summaries. These data presentations make the numbers accessible to shareholders, analysts, and industry partners alike. The graphic design approach held visual consistency across data visualizations, supporting graphics, and page layouts throughout the report.
Print Production Coordination
Walk Production prepared print-ready files from pre-press checks through final file handoff to the appointed printing vendor. Color accuracy, paper selection, and finishing specifications were documented to support an annual report that meets the expectations of a publicly listed company. Each stage of file preparation was reviewed to maintain quality standards across the final vendor files.
Vendor file support covered timeline management between design approval and print file handoff to meet Sunview’s reporting schedule. File handoff planning accounted for proofing files, material specifications, and approval checkpoints within the required timeline. The appointed printing vendor produced the final printed publication for the company’s shareholder, regulatory, and institutional use.
The Results
The completed annual report gives Sunview’s shareholders a structured view of financial performance, project achievements, and strategic direction for the year ahead. The publication records the year’s progress across business segments, operational areas, and forward planning.
The report pairs considered design with clear data presentation, serving as a reference document for shareholders, analysts, and industry partners through the reporting year. The printed publication reflects Sunview’s standards and supports its investor relations and communication objectives.
Related Questions
What makes annual report design for renewable-energy companies distinctive?
Renewable-energy annual reports typically feature approved project imagery, plant and site visuals, and capacity or generation data alongside detailed financial reporting. Design must balance large-scale project visuals against financial statements and governance disclosures. The visual approach has to signal technical capability and institutional credibility to a mixed readership.
How is project portfolio data presented in annual reports?
Project portfolios are presented through approved imagery, capacity figures, timeline summaries, and location information in structured formats. Visual layouts help readers understand project scale, status, and geographic distribution. Clear formatting allows investors to compare projects at a glance.
Why is print quality important for annual reports?
Print quality reflects a company’s standards in the eyes of investors, regulators, and business partners. For listed companies, the annual report is a primary shareholder communication tool. Final publication quality influences perceptions of credibility and attention to detail across every other business communication.
What sections are typically included in a renewable-energy firm’s annual report?
Typical sections include financial statements, management discussion, project portfolio, corporate governance, sustainability reporting, board profiles, and market outlook commentary. These sections meet regulatory requirements while giving readers a full view of operational performance and strategic direction in the solar and renewable-energy sector.
How do infographics help communicate financial performance?
Infographics convert financial tables into visual formats such as charts, trend indicators, and comparison graphics for easier reader comprehension. This helps readers quickly identify key performance trends and year-on-year changes in results. Visual data presentations and supporting report copywriting make annual reports more accessible to non-financial readers and support faster understanding of the year’s results.